Do you find it difficult to save money? You’re not alone if saving money is hard for you. In fact, 70% of Americans have less than $1,000 stashed away! Sometimes we find ourselves having the wrong mindset when it comes to saving money. Rather than looking at it as a restriction of your finances, try to look at it as your path to financial freedom.
Saving money is essential to financial success. It can create a secure financial future and prevent you from going into debt. You will have money stashed away for emergency expenses or that much-needed vacation instead of racking up credit card debt.
Money-savings charts can make saving money fun. Having multiple savings charts is even better. You can have a chart for different things you want to save for, i.e., vacations, shopping, etc. Whatever your savings goals are, money-saving charts can help you build your savings accounts fast!
What are money-savings charts?
Money-savings charts are printable charts that help you track money for specific savings goals. It will list the amount you are supposed to save for that day or week, and you will track your balance and when you complete each deposit. Like a vision board, money-savings charts makes saving money easier because it is a visual aid that helps you focus on your progress and goals!
Top 10 instances to use money-savings charts
Check out these 10 chart ideas to get started saving money now! You can create these charts easily on your own by using a notebook or spreadsheet.
1. 52-week savings
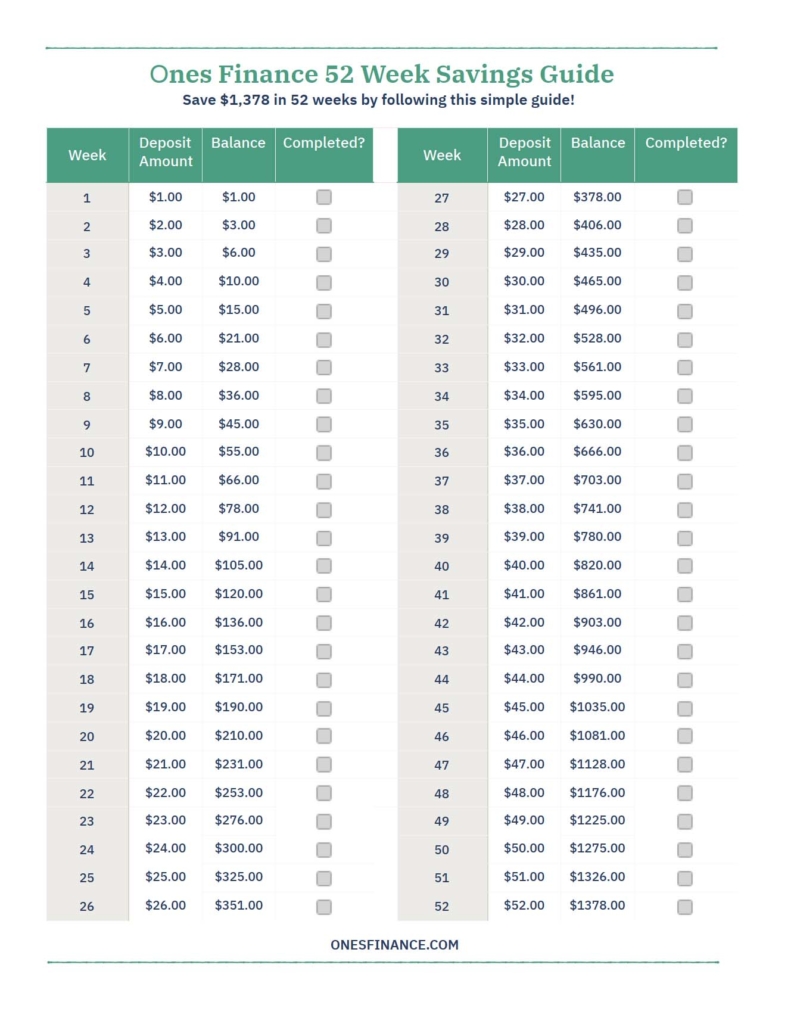
One of the best money-savings charts to start with is the 52-week savings challenge. This is one of the easiest charts to follow because you start with $1 the first week and add an extra dollar each week. For example, in week one, you save $1, week two, you save $2, week three, you save $3, and so on until you get to week 52. If you follow this simple money-saving chart, you will save $1,378 in just a year! This savings plan is perfect to bulk up your emergency fund or if you’re trying to save for a luxury purchase.

2. Emergency savings
Having an emergency fund is crucial to your financial wellbeing. It can prevent you from going into debt due to unexpected emergencies such as a job loss or if your vehicle breaks down. The goal is to have 3-6 months of basic living expenses in your emergency savings account.
One of the most important money-saving charts you can utilize is one for an emergency fund. It will help you calculate how much your living expenses are and how much you will need to save. For instance, if your monthly living expenses are $1,500 per month, you will need to save $4,500-$9,000. Don’t get overwhelmed by this number. Simply focus on setting aside a certain percentage of your paychecks such as 10-15% or a set amount such as $50 every week to reach your goal.
3. 26-week savings
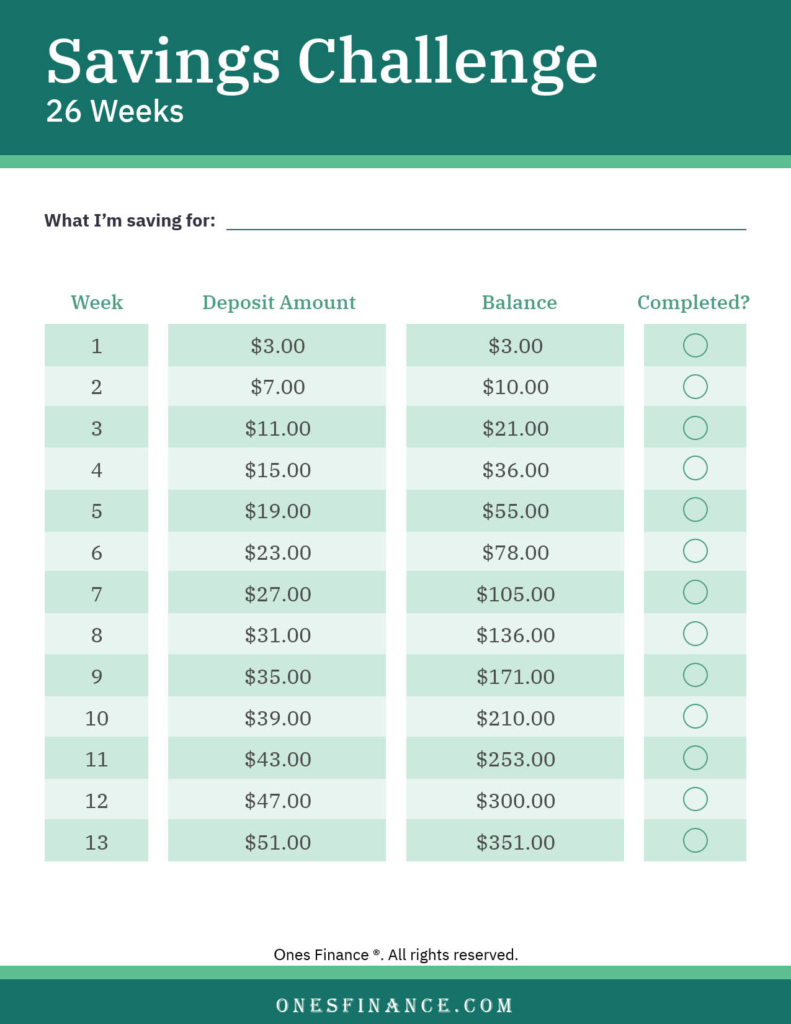
If you want to save faster than the 52-week chart, then the 26-week money-saving chart is for you. You will save $1,378 in six months rather than a year. This chart lists weeks 1-26 and the amount for each week. Rather than only adding an additional dollar to each week, you will add an additional $4 every week until you reach 26 weeks.
The first week you will deposit $3, week two will be $7, week three, you will save $11, and the amount increases each week. It provides the amounts for each week, the balance, and a place to check off that you completed the deposit!

4. Saving $10,000
Who wouldn’t want to have an extra $10,000 in their savings accounts? This may be a big goal, but it’s something you can accomplish with a bit of determination and discipline. To save $10,000 a year, you need to save $833.33 every month. This equals $192.30 per week. You can even break it down by the day, which means you need to save $27.47 per day.
Not sure if you can swing that much with your current take-home pay? Start a side-hustle to bring in extra income so you can reach your money-goals faster! This is one of the best money-saving charts to help you reach a big savings goal.
5. Spare change savings
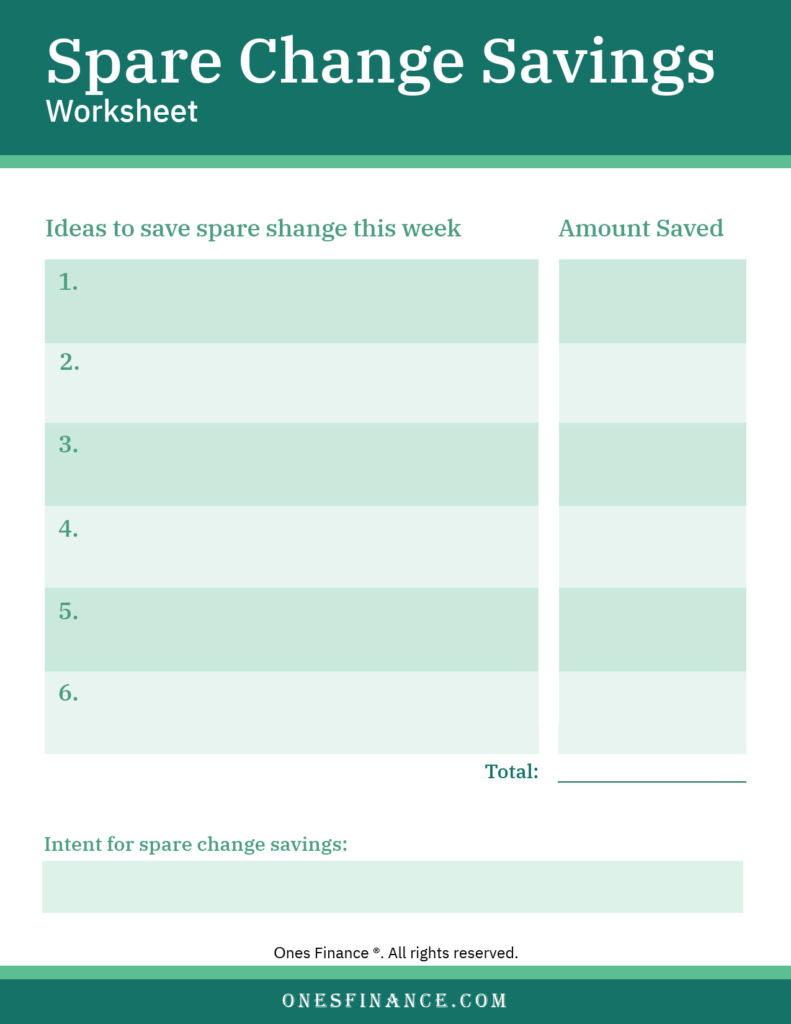
You’d be surprised how much spare change you have lying around. The spare change money-saving chart has a place to write in ideas to save spare change and the amount you save. It has a spot to add up all of your extra coins at the bottom of the chart and what you’re saving your change for. Check your car, laundry, etc. for places you may have loose change. Start using cash instead of a debit card so you can receive coins to save regularly. Tally it up and deposit it into your savings account for a rainy day fund!

6. House down payment savings
Purchasing a home is one of the most significant purchases you will make in your life. You must save a sufficient down payment before buying a house because it can prevent you from paying Private Mortgage Insurance (PMI) and will help you have more equity in your home.
You can make a money-saving chart to help you save a down payment for your first home. To know how much you will need to save you will need to know how much home you can afford without being house poor. Let’s say you plan on purchasing a home that costs $175,000. Your goal should be to save 5%-20% of the purchase price.
So, you will need to save between $8,750-$35,000 for a down payment on a house. The house down payment money-saving chart will be like the $10,000 chart. You will need to figure out how much per month you will need to save to reach your goal.
If you’re looking at buying a home in two years, then take the amount and divide it by 24 months. For example, $15,000 divided by 24 equals $625 a month. You will take that amount and create your savings chart to help track your progress and balance each month to ensure you stay on track.
7. Vacation savings
Vacations are fabulous, but they can get expensive fast. To prevent from going into debt, create a vacation budget so you know how much you can spend. Once you pick your destination, you can estimate the cost of your vacation and use that to create a vacation money-saving chart. Of course, you will need to have a timeline of how long you have to save as well.
Once you get the numbers crunched, you can calculate how much you need to save every month. If your estimated vacation cost is $2,500 and you want to go within six months, you will need to save $416.67 a month, which amounts to about $105 a week. This chart will help you save for a fantastic budget-friendly vacation!
8. Dream wedding savings
Some believe you have to spend a ton of money to have the wedding of your dreams, but you can have your dream wedding even on a budget. Plus, that’s more money you can save towards a house or retirement instead! To properly save for your dream wedding, you need to plan how much it’s going to cost you.
Set an amount that you are going to spend and base your dream wedding money-savings chart on that amount. Be determined to not bust your budget on your wedding. Just like the vacation chart you need to calculate how much you need by what date and break it down into monthly savings goals. Keep in mind the average wedding costs a whopping $34,000! Try to find ways to be budget-friendly and stash the extra cash instead.
9. Christmas money savings
The holidays may be the most wonderful time of year, but not so much for your finances. The average person spends over $1,000 on traveling and gifts at Christmas. It’s important to save for your holiday shopping rather than charging it on your credit cards.
A Christmas money-saving chart is the perfect way to prepare for the holidays. Figure out how much you plan on spending for Christmas and how many months you have to save for it. The earlier you start saving, the easier it will be. Open a Christmas Club account to keep your holiday money separate.
10. Saving $1,000
A great goal to set for yourself if you’re not a natural saver is to save your first $1,000. This is a great goal to help you with your emergency fund too. Sometimes we can get overwhelmed with a big number, so making it more attainable will help you stick with it too.
This savings chart helps you save $1,000 in a year. However, if you want to bulk up your savings faster, divide $1,000 by how many months you would like to save it in. If you want to save $1,000 in 3 months, you will need to save $83.33 a week! This is a great chart to get you started saving money.
Saving money can be fun!
There’s no doubt that it’s easier to stick with a good habit if you make it fun. Money-savings charts are an excellent way to make saving money fun! To help you keep your financial goals in mind, make a finance vision board along with your charts of what you want to accomplish.
When you have a visual reminder of your goals, it keeps you focused on the end-game. Are you ready to start saving? Pick one of these savings charts to start saving.

